

Rack Mini Profiler
An introduction to Ruby profiler tool


In software engineering, profiling is a process to analyzing and measuring the performance of software program.
The primary goal of profiling is to identify areas of code that consume the most resource so developer can optimize it.
Rack mini profiler is a profiler tools for Ruby program (including Rails). The tools itself already included in default Gemfile for Rails >6.
In this article, we’ll see on how to use this tool for profiling simple Rails application.
Installation
The installation for the tool is really simple, what you only need to do is to add this gem "rack-mini-profiler”, “memory_profiler” and “stackprof” to your Gemfile:
group :development do
  # Use console on exceptions pages [https://github.com/rails/web-console]
  gem "web-console"

  # Add speed badges [https://github.com/MiniProfiler/rack-mini-profiler]
  gem "rack-mini-profiler"
  gem "memory_profiler"
  gem "stackprof"

  # Speed up commands on slow machines / big apps [https://github.com/rails/spring]
  # gem "spring"
end
Run bundle install and then restart your rails server. That’s all.
Now, you can go to your application, and you’ll see this badge to your development page
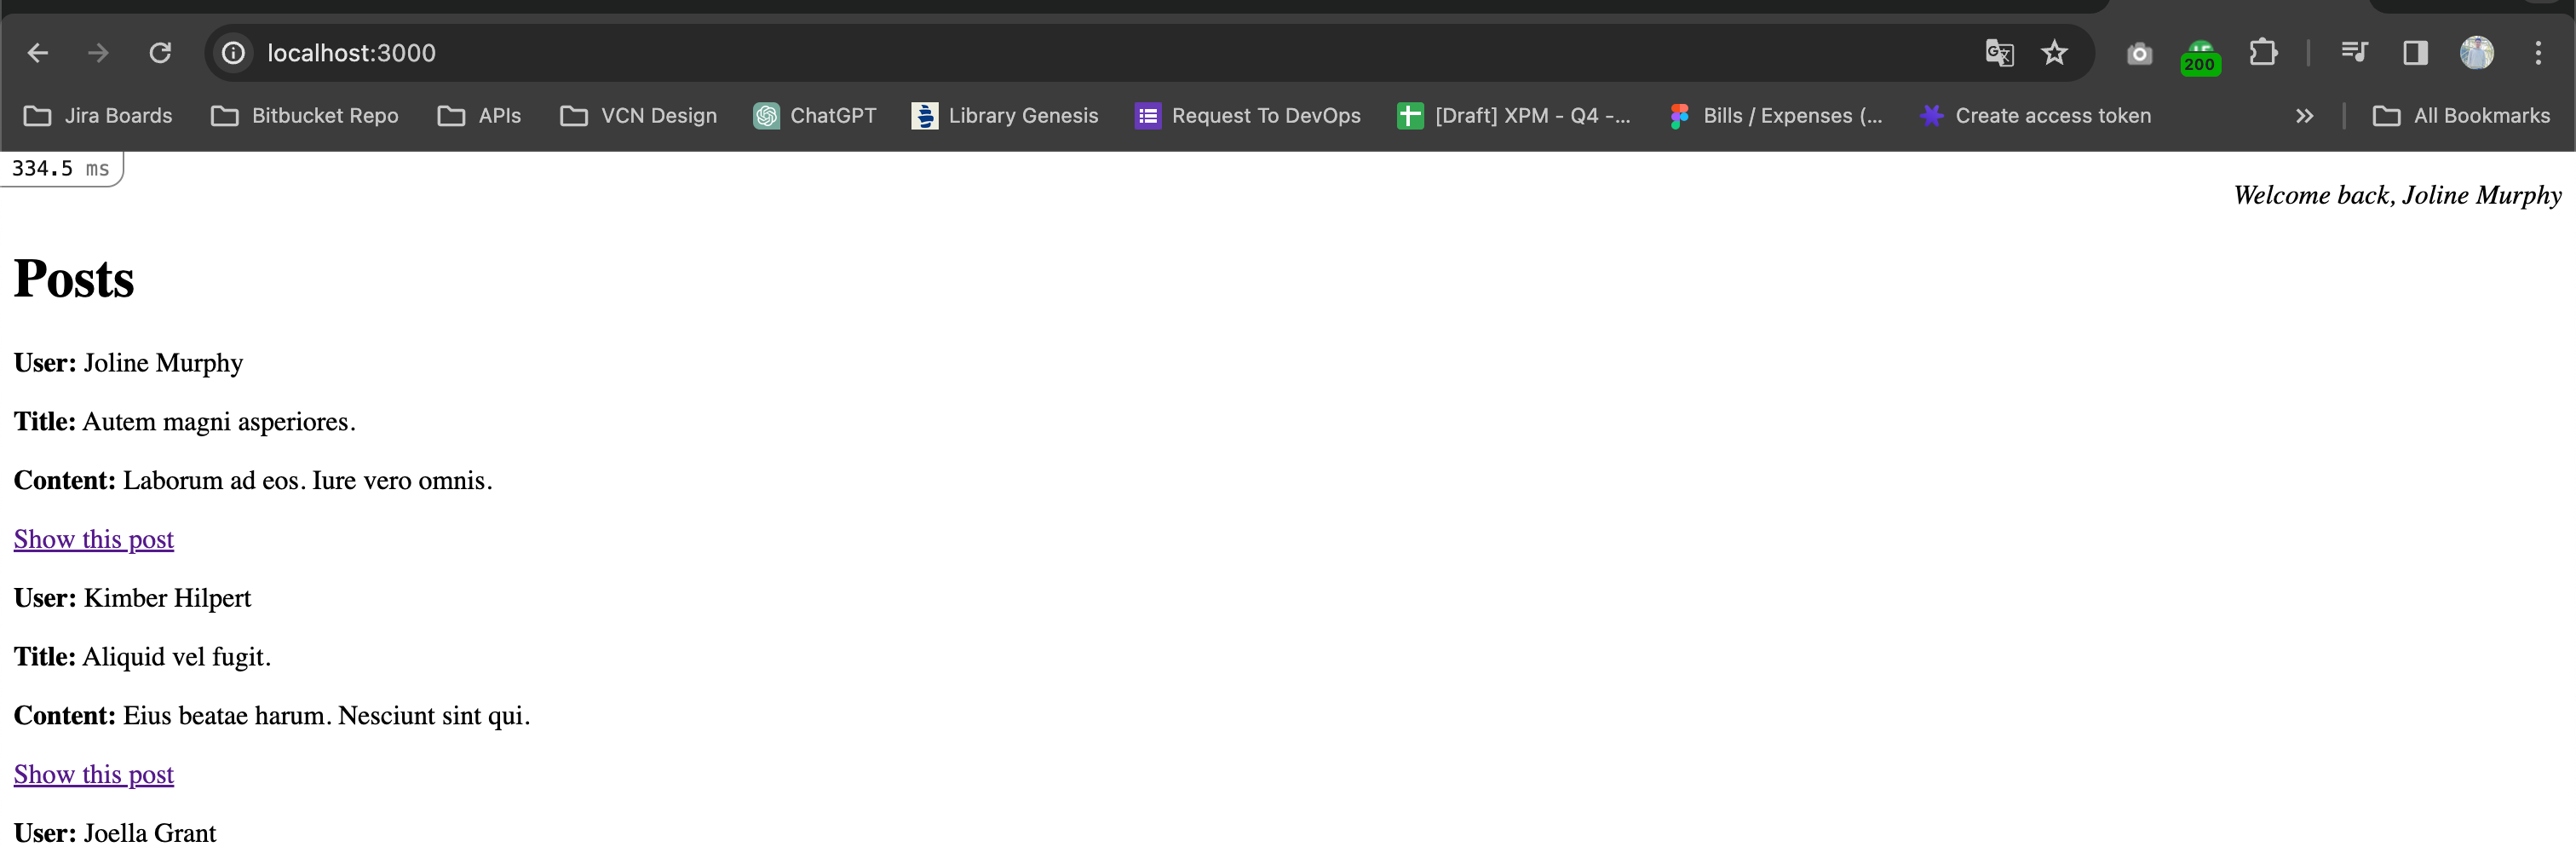
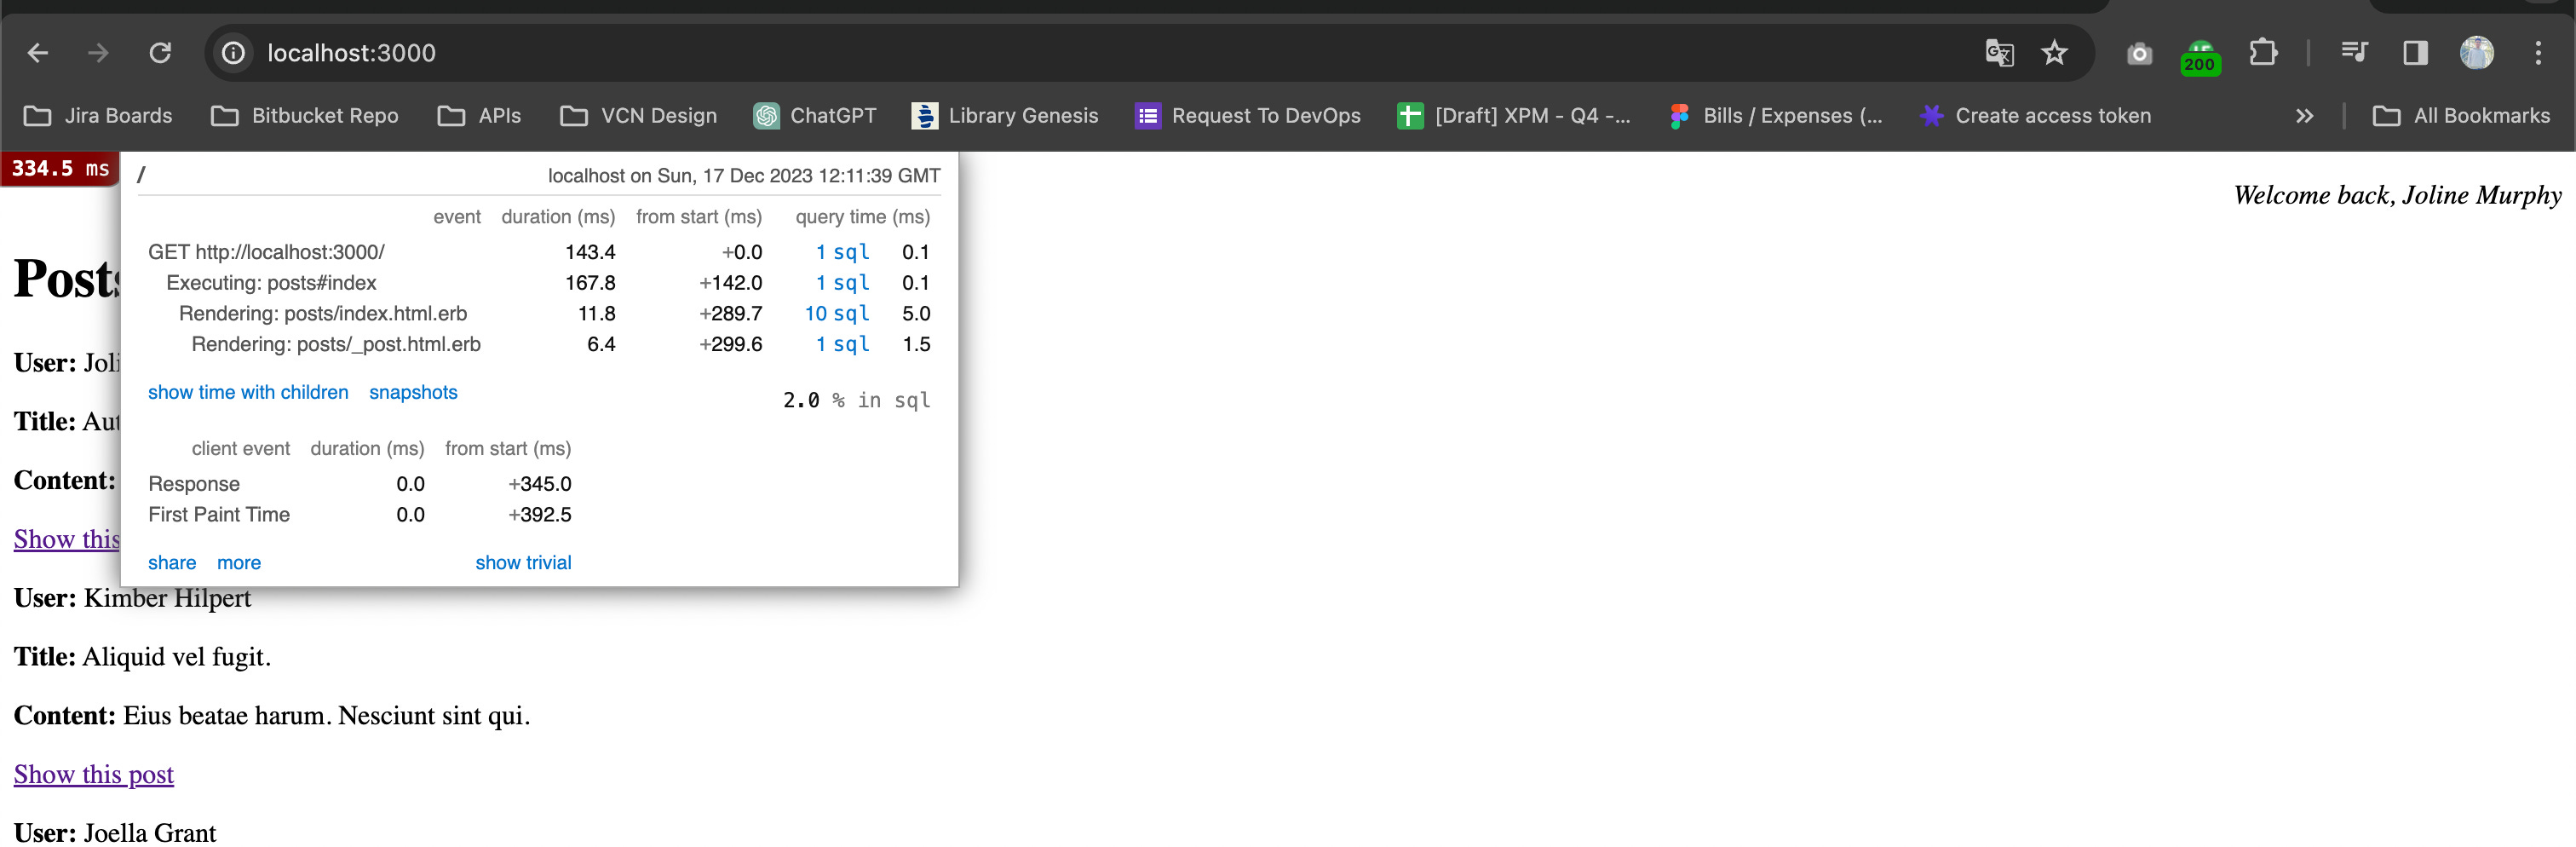
You’ll see the badge in the top left our development page. From that badge, now we know how much time that spent to render our page. Not only the total time, we also get more information like how much total SQL queries that our system run for rendering the page.
Database SQL Queries
Before we dive in into database SQL queries, let’s see what’s our code looks like to give you more context:
# app/controllers/posts_controller.rb
class PostsController < ApplicationController
  before_action :set_post, only: %i[ show edit update destroy ]

  # GET /posts or /posts.json
  def index
    @posts = Post.all
  end

  # ...
end
<!-- #app/views/posts/index.html.erb -->

<p style="color: green"><%= notice %></p>

<h1>Posts</h1>

<div id="posts">
  <% @posts.each do |post| %>
    <%= render post %>
    <p>
      <%= link_to "Show this post", post %>
    </p>
  <% end %>
</div>

<%= link_to "New post", new_post_path %>
<!-- app/views/posts/_post.html.erb -->

<div id="<%= dom_id post %>">
  <p>
    <strong>User:</strong>
    <%= post.user.name %>
  </p>

  <p>
    <strong>Title:</strong>
    <%= post.title %>
  </p>

  <p>
    <strong>Content:</strong>
    <%= post.content %>
  </p>
</div>
As you can see, it’s pretty simple application. In this page, we only listing our posts data with some information: The post title, content and the creator name.
Our profiling tools give us information about SQL queries. Mostly in web application, database is one of the most common performance issues. And mostly, when you have more SQL query that runs, the more slow your application.
So, this information really helpful to help us improving our application.
Back to our sample application. As you can see, we have N+1 SQL query issues. Our system always running SQL SELECT “users.*” FROM “users” WHERE ..” every time rendering our /_post.html.erb partial layout.
We can fix this by including (preload or joining) the users table when we finding all the posts.
class PostsController < ApplicationController
  before_action :set_post, only: %i[ show edit update destroy ]

  # GET /posts or /posts.json
  def index
    @posts = Post.includes(:user).all
  end
end
After the fix, let’s see our benchmark again:
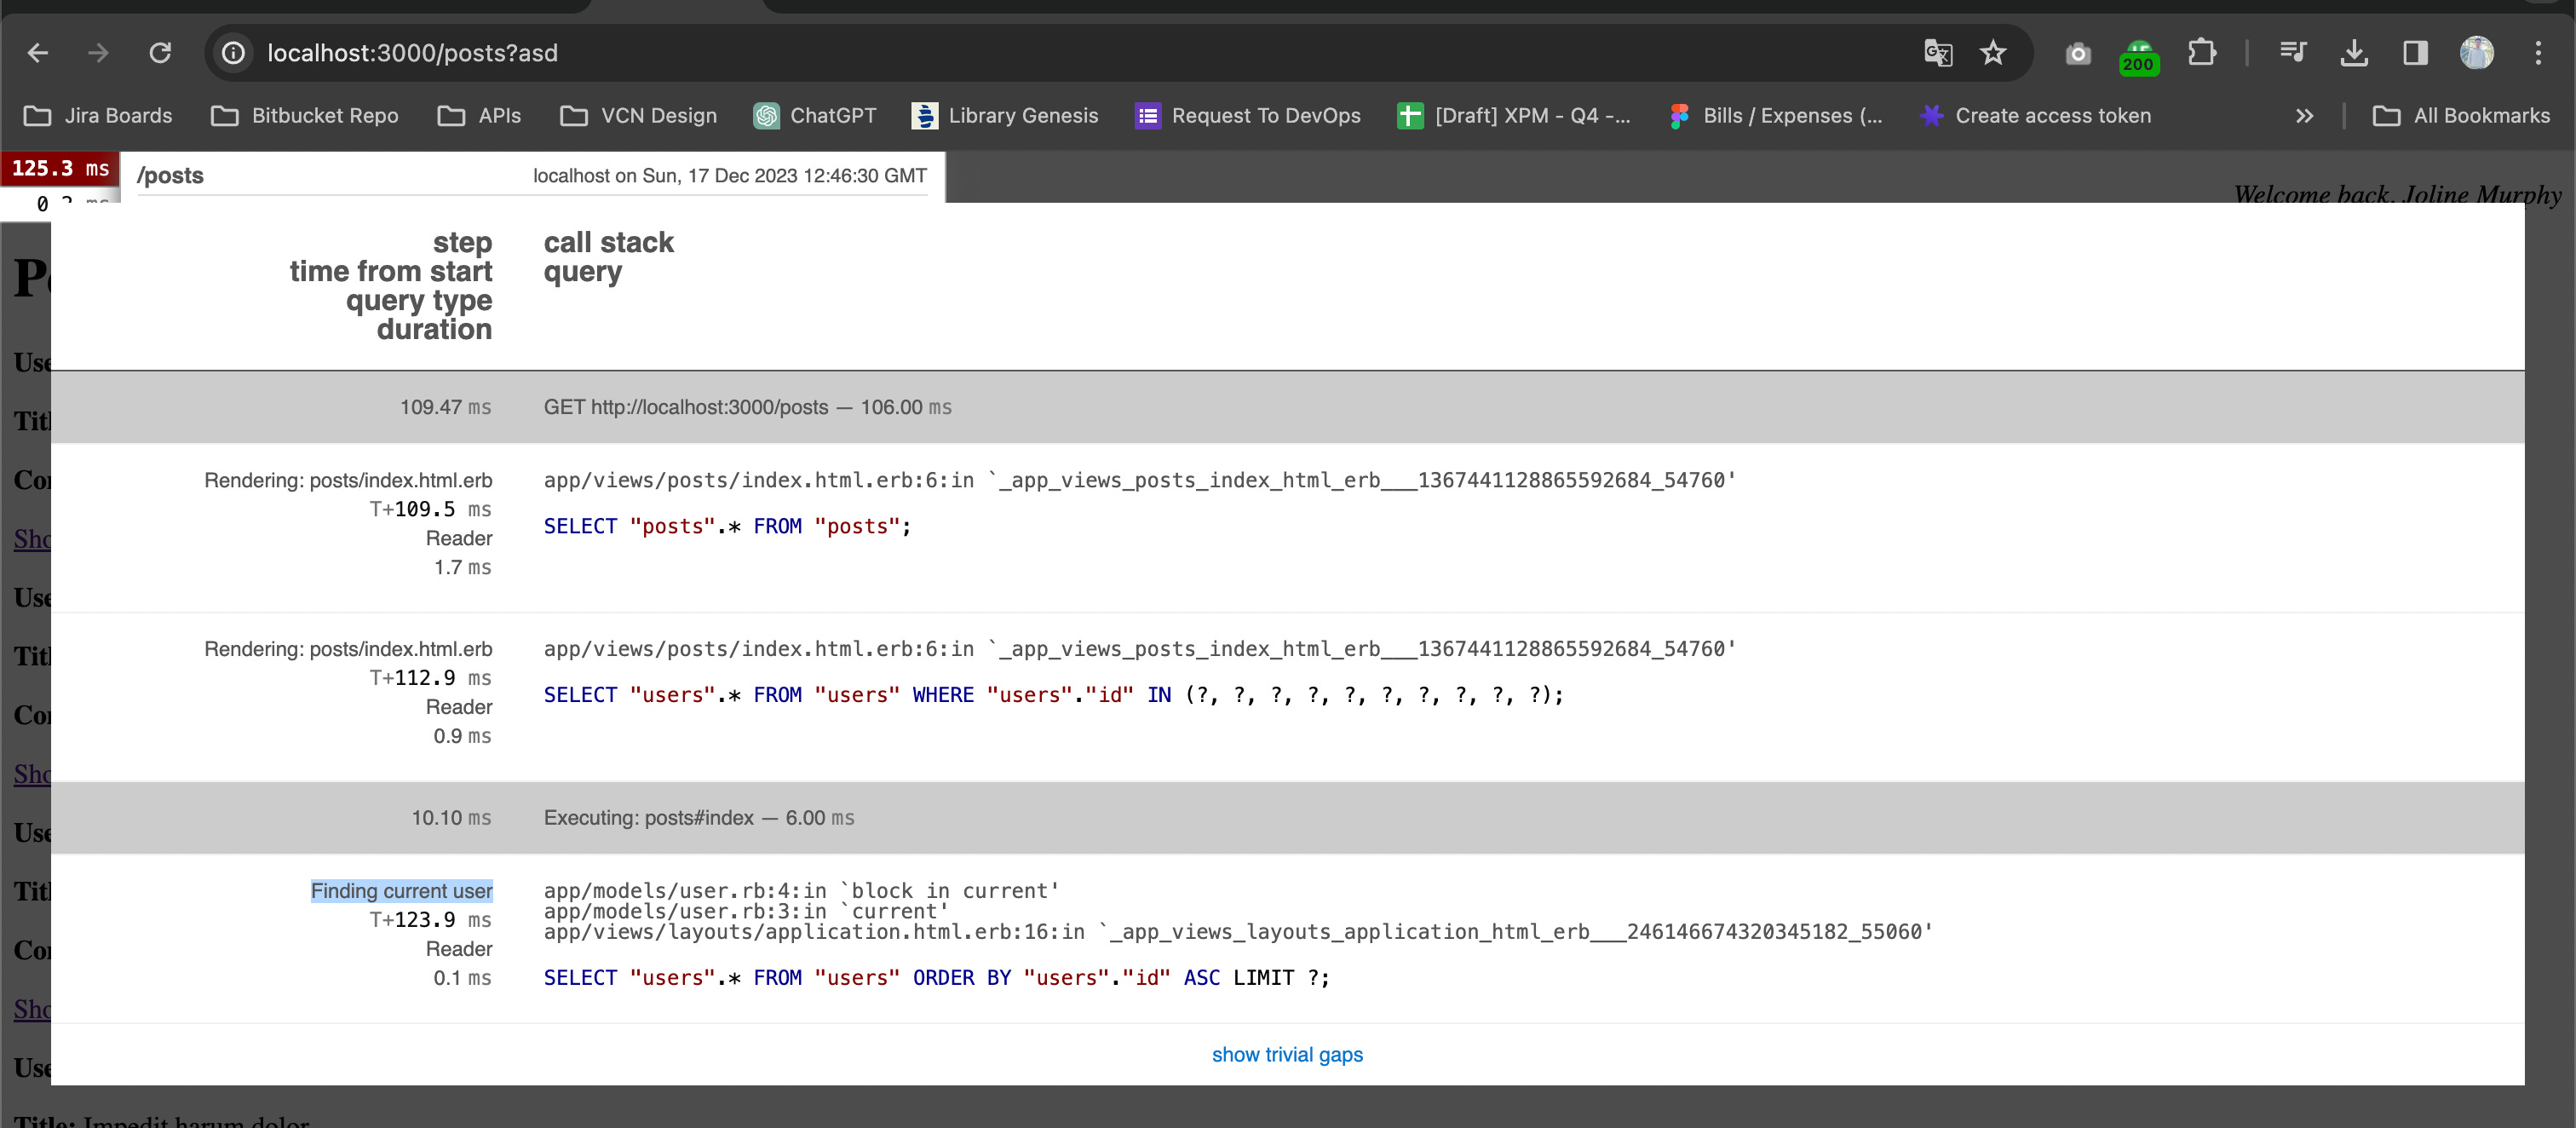
Now, we only have 3 SQL query in this page:
Finding the list of posts
SELECT “posts.*” FROM “posts”Finding the list of users that has related to our posts
SELECT “users.*” FROM “users”.”id” IN (…The last one is the SELECT “users.” FROM users ORDER BY “users”.”id” ASC …
The last query is for showing the current user name: “Welcome back, Joline Murphy”. Here’s the code
<!-- app/views/layouts/application.html.erb -->

<body>
   <p style="text-align: right">
      <i>
        Welcome back, <%= User.current.name %>
      </i>
   </p>
   <%= yield %>
</body>
# app/models/user.rb
class User < ApplicationRecord
def self.current
User.first
end
endRack mini profiler also allowing us to add additional information to the benchmark. Let’s say we want to define User.current to identify process to finding the current user:
class User < ApplicationRecord
  def self.current
    Rack::MiniProfiler.step "Finding current user" do
      User.first
    end
  end
end
Now, we’ll see this in our badge:
The profiling also work for HTTP method other than GET. In this example, we’ll see benchmark for HTTP POST method:
But, in Rails 7, we need to custom the configuration a little bit, to support the Rails turbo transition:
if defined?(Rack::MiniProfiler)
  Rack::MiniProfiler.config.enable_hotwire_turbo_drive_support = true
end
Memory Usage
The second common issue in the web application is the high memory usage (RAM) issues. RAM is the critical hardware in server, running our memory could be make our server crash, that makes our user cannot use our application.
So, we need to keep track and understand on how our application use RAM.
Let’s back to our app, and see how much memory that used for rendering the page:
On that reports, they categories the memory usages into:
allocated memory by gem
allocated memory by file
allocated memory by location
allocated memory by class
allocated objects by gem
allocated objects by file
allocated objects by location
allocated objects by class
retained memory by gem
retained memory by file
retained memory by location
retained memory by class
retained objects by gem
retained objects by file
retained objects by location
retained objects by class
allocated String Report
Not only memory, we also can see reports on objects.
Now, let’s try to improve our memory usage, with decreasing allocated memory on out @posts variable.
Our @posts variable was stored in ActiveRecord::Relation class:

We allocated 1600 bytes for the @posts variable (without garbage collector).
Now, let’s improve it:
def index
    @posts = Post
      .joins(:user)
      .select("posts.id, posts.title, posts.content, posts.user_id, users.name")
      .all
  end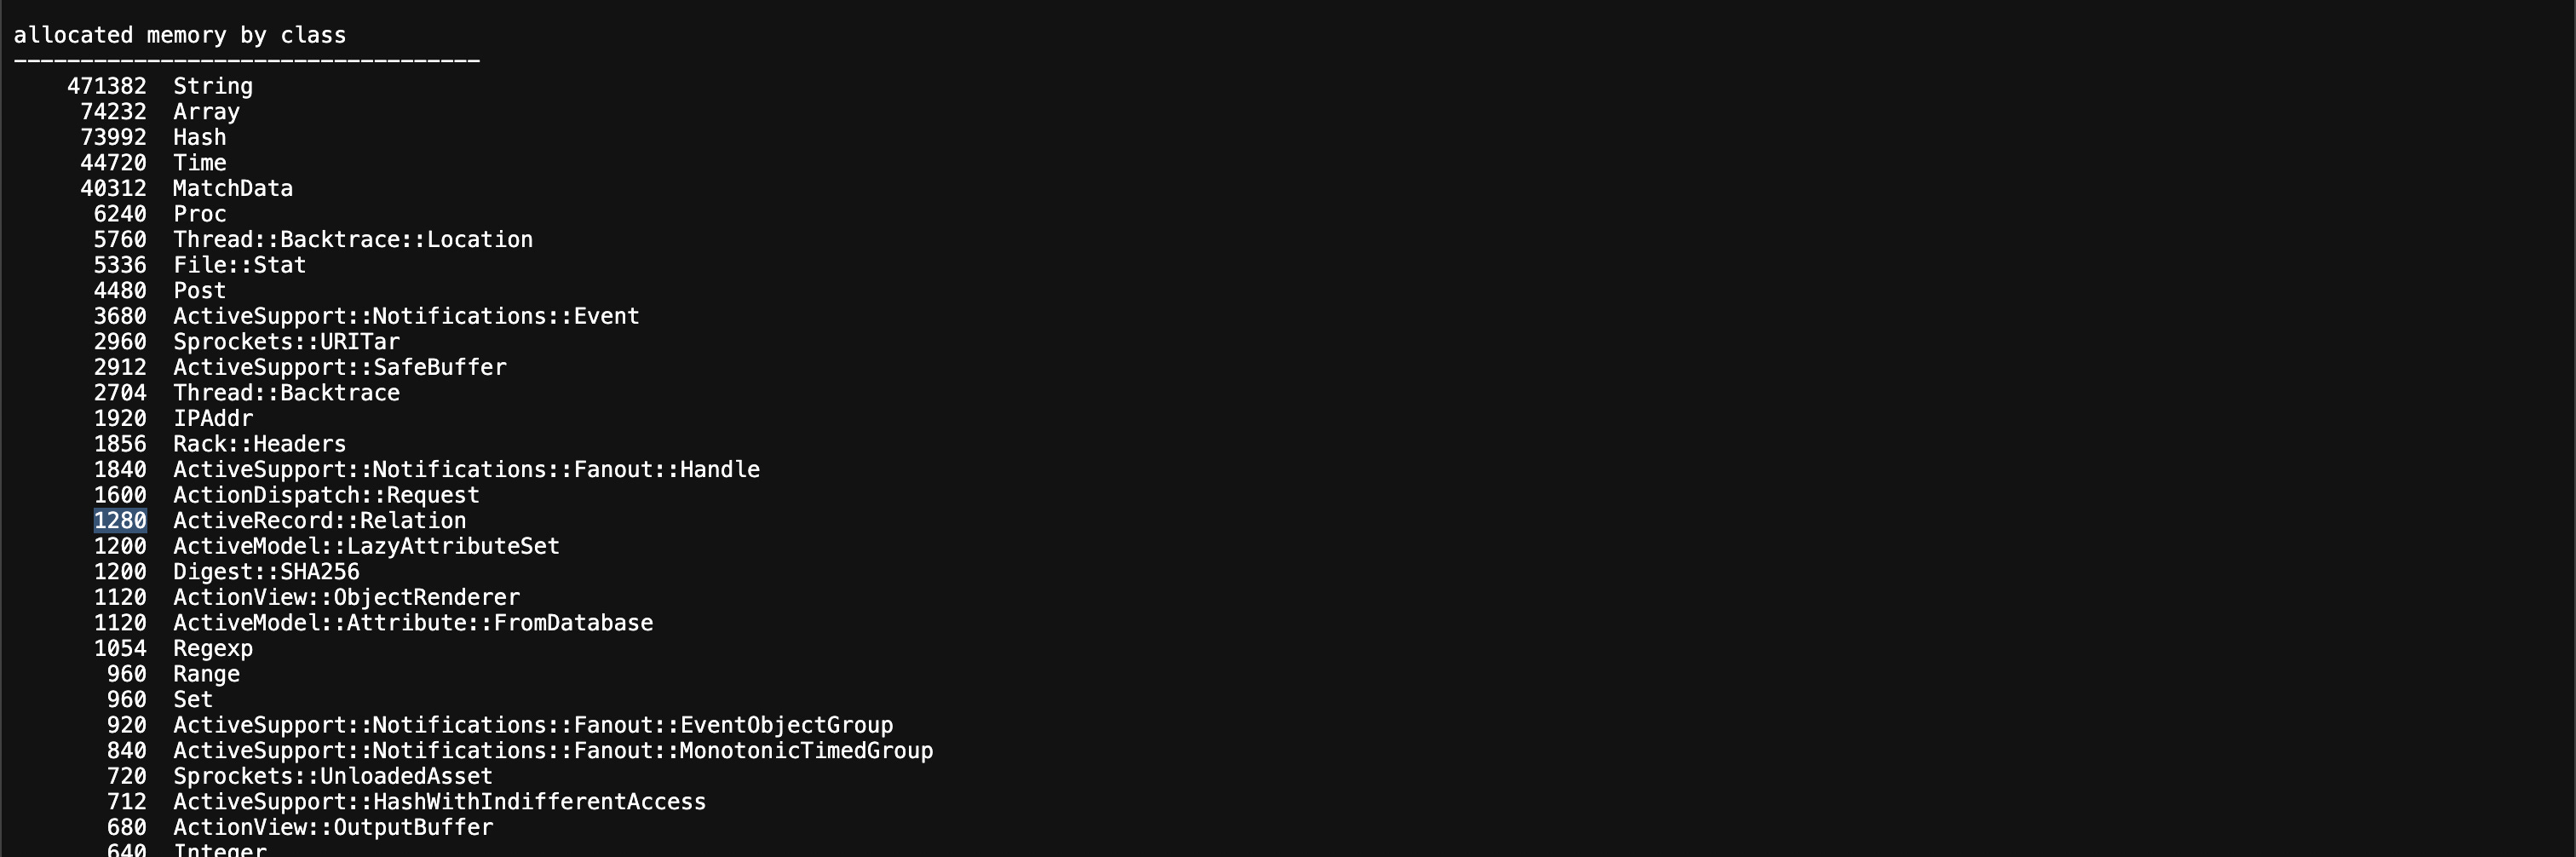
It’s now improved from allocated 1600 bytes to 1280 bytes by using select. By using select we don’t save some variable that we don’t need like created_at, and updated_at from both posts and users table.
CPU Usage
CPU (Central Processing Unit) is a hardware to allow our computer can think. It’s also important as memory usage and it’s also the most common issue in web application.
Rack mini profiler also allow us to understand on how our application using the CPU.
But, before we see the profiling report, let’s update our application to allow our CPU to think more by adding some complex task:
# app/models/post.rb
class Post < ApplicationRecord
  belongs_to :user

  def uuid
    uuid = ""
    1000.times do
      uuid = SecureRandom.uuid
    end
    uuid
  end
end
And call this function in the view:
<div id="<%= dom_id post %>">
  <p>
    <strong>UUID:</strong>
    <%= post.uuid %>
  </p>
  <p>
    <strong>User:</strong>
    <%= post.user_name %>
  </p>

  <p>
    <strong>Title:</strong>
    <%= post.title %>
  </p>

  <p>
    <strong>Content:</strong>
    <%= post.content %>
  </p>
</div>
So, i tried to add some UUID attribute to our list of posts page. Now, let’s see how it goes:

To profiling the CPU, you can choose the flamegraph option with CPU mode.
Flamegraph is a visual reporting based on stack. Every element (box) in the report indicate the function. System calling function from top to the bottom. This means that the bottom element (child) is called by their top (parent).
There are three categories on this report, which is:
Time order. To allow you to see the report based on the timestamp. The function will be ordered by what time they was called by system.
Left heavy. Will order from left to right from the high usage. The most high usage is on the left, and the less usage will be on the right.
Sandwich, it give a list of function calls (flat). And have an order icon so you can order the list by the most total usage, self usage, and function name (symbol). You can order by ASC or DESC for all the option columns.
In this case let’s use sandwich to see our Post#uuid:
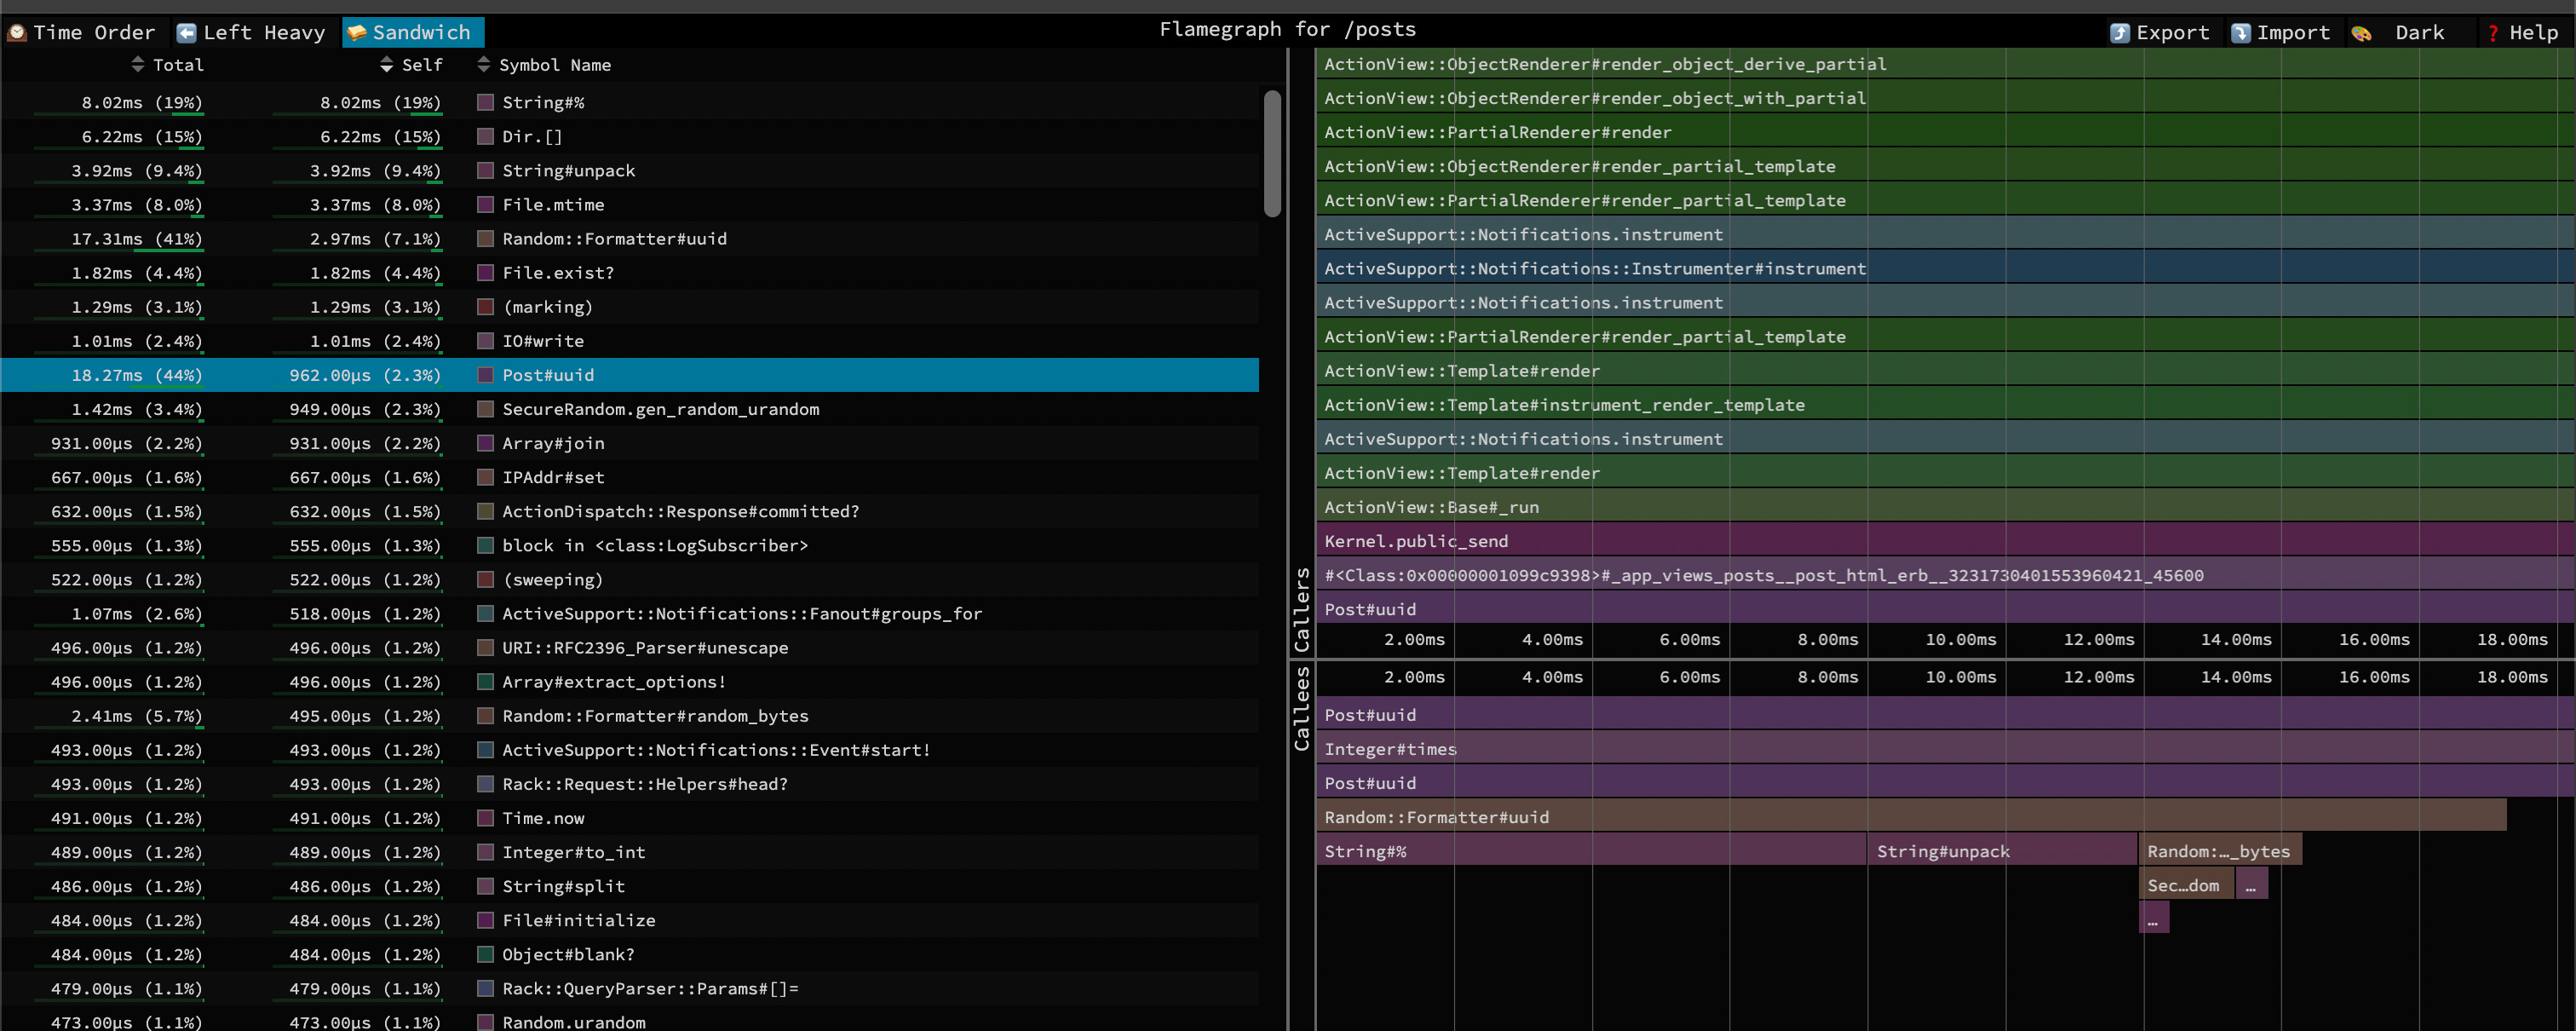
We got this info:
Total 18ms (44%)
Total 962 micro second (2,3%)
In total we’ll including the function that they call into calculation, while in self, it’s only calculate the function itself without including the function that we called.
That’s why in total we got a lot of resource while in self with have a less one. Because in our function, we just loops the SecureRandom.uuid function.
44% and 2,3% is presenting the ratio time spend for the function calls. But we can assume that the more time the function the more they use the CPU. So when we can decreasing the time, we can improve the CPU usage.
Running it in production
There are cases that we want to benchmarking in production. Because development and production not always the same thing. Sometimes we have different config (ie: assets precompile) or we have different data that will impact to the benchmark.
Rack mini profiler allow us to do it, they recommend us to add a unique parameter to show the badge (report) like:
?enable_rpm=true# app/controllers/application_controller.rb
class ApplicationController < ActionController::Base
before_action do
if params[:enable_rpm] == 'true'
Rack::MiniProfiler.authorize_request
end
end
endAlso, they recommend us to change the storage to Redis, since by default the reporting data stored in file system, you can do that by updating the config/initializers/rack_mini_profiler.rb
if Rails.env.production?
  Rack::MiniProfiler.config.storage_options = {
    url: ENV["REDIS_URL"],
    ssl_params: { verify_mode: OpenSSL::SSL::VERIFY_NONE }
  }
  Rack::MiniProfiler.config.storage = Rack::MiniProfiler::RedisStore
end
Conclusion
Rack mini profiler has other benchmarking features:

That you can use to profiling your application in more advance. But, in this post we’ll discuss on the basic benchmarking feature to analysis and measure:
Database Queries
Memory Usage
CPU Usage
Also, they can running in production to allow you benchmarking or measure the application with production configuration and production data (which is needed is some case).
That’s all for the article, see you in another post.
Thank you for the reading!